---
# Building a Real Monitoring Stack: From 3 Alpine Containers to One UBI 10 Image with Zabbix
**URL:** https://crunchtools.com/zabbix-monitoring-stack-alpine-to-ubi10/
Date: 2026-02-21
Author: fatherlinux
Post Type: post
Summary: I rebuilt my entire Zabbix monitoring stack — consolidating three Alpine containers into a single UBI 10 image, wiring up CloudFlare health checks, and building an IT Services dependency tree. With Claude Code and an MCP server, AI can now troubleshoot my infrastructure directly.Continue Reading "Building a Real Monitoring Stack: From 3 Alpine Containers to One UBI 10 Image with Zabbix" →
Categories: Articles
Featured Image: https://crunchtools.com/wp-content/uploads/2026/02/thumbnail_new.png
---
I’ve been building so much infrastructure with Claude Code lately that I started to lose track of what was actually running — which technologies were in each container, what services depended on what, and how to fix things when they broke. I wanted a more transparent way to monitor everything, and critically, a programmatic way to give Claude Code access to that monitoring data through an MCP server so it could troubleshoot problems itself. AI works best when you combine it with deterministic frameworks, and monitoring is no different.
I used Nagios and Cacti as a combination monitoring and data acquisition solution for many years at my job previous to Red Hat. Then I ran the same Nagios/Cacti stack for probably 5-7 years afterwards, but my homelab solution fell into disrepair. With the advent of AI, and in particular Claude Code, I can now implement and maintain a much more sophisticated monitoring and data acquisition solution with probably 10% of the maintenance. So I decided to try something newer than Nagios and picked Zabbix.
## The Problem with Three Containers
The first challenge was how to run it. Claude Code initially architected a solution using the community Zabbix containers built on Alpine — `postgres:16-alpine`, `zabbix-server-pgsql:alpine-7.0-latest`, and `zabbix-web-apache-pgsql:alpine-7.0-latest` running together in a Podman pod. It worked, but I don’t like using Alpine. I wanted to keep everything on UBI 10, in the Red Hat ecosystem.
I’ve also chosen a “one container with several services inside” architecture for my homelab. I know other people prefer pods, but I’m not quite ready to move to OpenShift or Kubernetes for a homelab. I’m running a small Linode with 8GB of RAM and I’m looking to conserve resources. I could use MicroShift or Minikube, and I might eventually, but for now I just want to use Podman with single containers for each site. Every service — WordPress, MediaWiki, Request Tracker, Ghost — runs as a single UBI 10 container with systemd managing the internal services. PostgreSQL inside the container, Apache, PHP-FPM, the application — all supervised by systemd, all in one image. The Alpine pod was the odd one out.
So I built a unified container. The base image is `quay.io/crunchtools/ubi10-httpd-php`, which already has systemd, httpd, PHP 8.3, and cronie. I layered on PostgreSQL, the Zabbix 7.0 RPMs from the official repo, and a first-run init unit that handles database setup. The existing PostgreSQL data directory mounts right in — no migration, no dump/restore:
```
FROM quay.io/crunchtools/ubi10-httpd-php
RUN dnf install -y postgresql-server zabbix-server-pgsql \
zabbix-web-pgsql zabbix-apache-conf && dnf clean all
# Full libcurl needed for Zabbix JavaScript HttpRequest TLS
RUN dnf swap -y libcurl-minimal libcurl && dnf clean all
```
The full Containerfile — including first-run database init scripts, Alpine-to-RHEL UID migration, and Zabbix config — is on GitHub: **[github.com/crunchtools/zabbix](https://github.com/crunchtools/zabbix)**
A few things worth highlighting:
- **`dnf swap -y libcurl-minimal libcurl`** — This was the hardest bug to find. Curl worked perfectly from inside the container, but the Zabbix JavaScript `HttpRequest` object — which links against `libcurl.so.4` — couldn’t complete HTTPS requests to external APIs like CloudFlare. Same library path, different package, different behavior. The `dnf swap` atomically replaces the minimal build with the full one.
- **`glibc-langpack-en`** — Required because the Alpine PostgreSQL container initialized the database with `en_US.utf8` locale. Without this package, PostgreSQL refuses to start on RHEL.
- **`fping` from EPEL** — A hard dependency of `zabbix-server-pgsql` that isn’t available in UBI or RHEL repos.
- **Two systemd oneshot services** — `zabbix-pg-prep` runs before PostgreSQL to fix UID ownership (Alpine uses UID 70, RHEL uses UID 26) and `zabbix-db-setup` runs after PostgreSQL to create the database and import the schema on first boot.
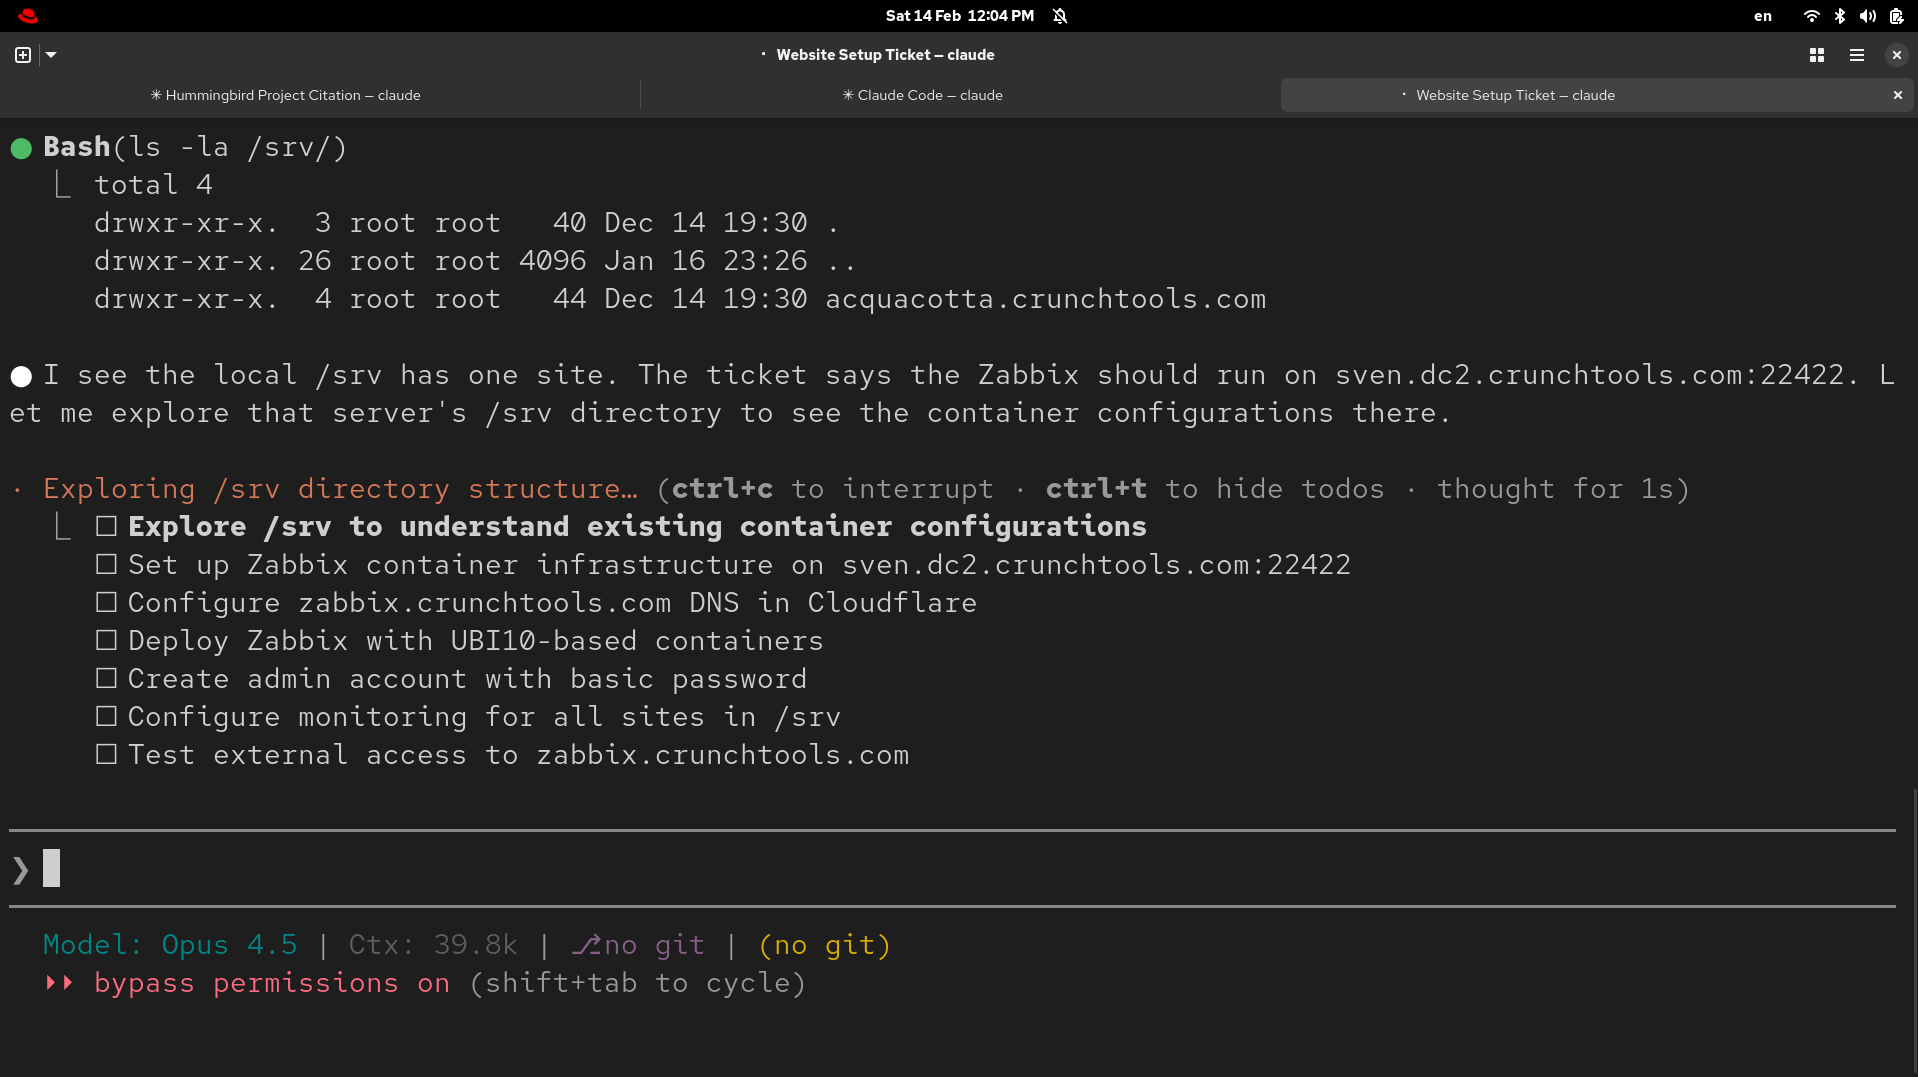Claude Code exploring the server and building its task plan for the Zabbix monitoring deployment
## A Custom Service Tree Dashboard
Once Zabbix was running in its new home, I wanted a single-page view of everything. Not the default Zabbix dashboards (which are great but very different than how my Linux-poisoned mind works), but something I could glance at in two seconds and know if anything was on fire.
I wrote `service-tree.php` — a PHP page that talks to the Zabbix API and renders an ASCII-style tree:
```
sven.dc3.crunchtools.com (Physical Host)
├── CPU ................................ OK
├── Memory ............................. OK
├── Disk (/) ........................... OK
├── Network (enp0s4) ................... OK
├── Containers (13 running) ............ OK
└── Zabbix Agent ....................... OK
crunchtools.com (Container - WordPress)
├── CloudFlare ......................... OK
├── Apache httpd ....................... OK
├── PHP-FPM ............................ OK
├── MariaDB ............................ OK
└── Web Health Check ................... OK
```
The physical host shows system health categories backed by trigger status. Each container host shows its services with real-time status from Zabbix items. The page auto-refreshes every 60 seconds and is volume-mounted into the container so I can update it without rebuilding the image.
For authentication, the script uses a Zabbix API token rather than hardcoding a username and password. Zabbix 7.0 supports bearer token auth natively — you create a token in the database, and every API call passes it via the `Authorization: Bearer` header. No login/logout dance, no password coupling. When I changed the Admin password through the web UI, the old hardcoded-password version broke immediately. The API token version doesn’t care.
## CloudFlare Monitoring with the Official Template
Most of my sites sit behind CloudFlare, and I wanted that visible in the monitoring stack. Zabbix ships an official “Cloudflare by HTTP” template that pulls zone analytics — bandwidth, cache hit ratios, response codes, threat counts.
I created four virtual hosts in Zabbix (one per CloudFlare zone), each linked to the template with a zone-specific API token. A Python script handled the bulk setup via the Zabbix API:
```
sites = [
("cf-crunchtools.com", "zone-id-here"),
("cf-educatedconfusion.com", "zone-id-here"),
("cf-fatherlinux.com", "zone-id-here"),
("cf-rootsofthevalley.org", "zone-id-here"),
]
for hostname, zone_id in sites:
zapi("host.create", {
"host": hostname,
"groups": [{"groupid": group_id}],
"templates": [{"templateid": tmpl_id}],
"macros": [
{"macro": "{$CLOUDFLARE.API.TOKEN}", "value": cf_token, "type": 1},
{"macro": "{$CLOUDFLARE.ZONE_ID}", "value": zone_id, "type": 1},
]
})
```
The service tree page maps these `cf-*` hosts back to their container hosts — so when you look at `crunchtools.com`, you see CloudFlare status right at the top.
One thing to note: the default template thresholds (50% minimum cache hit ratio, 30% maximum error rate) are tuned for high-traffic production sites. For personal sites with near-zero traffic, 0% cache and 100% non-2xx are normal in any given measurement window. I set the thresholds to 0% and 100% respectively — for personal infrastructure, the important signal is whether the CloudFlare API is reachable at all, not fine-grained analytics ratios.
## IT Services: Parent/Child Dependencies Like Nagios
The piece I missed most from my old Nagios days was the service dependency tree. If the physical host goes down, I don’t need 50 separate alerts for every container service. Zabbix IT Services does exactly this.
I built a 72-node service tree using the API. The trick is **problem tags** — you tag triggers with `host=hostname` and `service=servicename`, then configure each IT Service node to match on those tags. When a trigger fires, the matching service node turns red, and that status propagates up the tree.
The Python script that built the tree also tagged 315 triggers in bulk. LLD (Low-Level Discovery) triggers needed special handling — you can’t tag discovered triggers directly, but you can tag the **prototypes**, and discovered triggers pick up the new tags on the next discovery cycle.
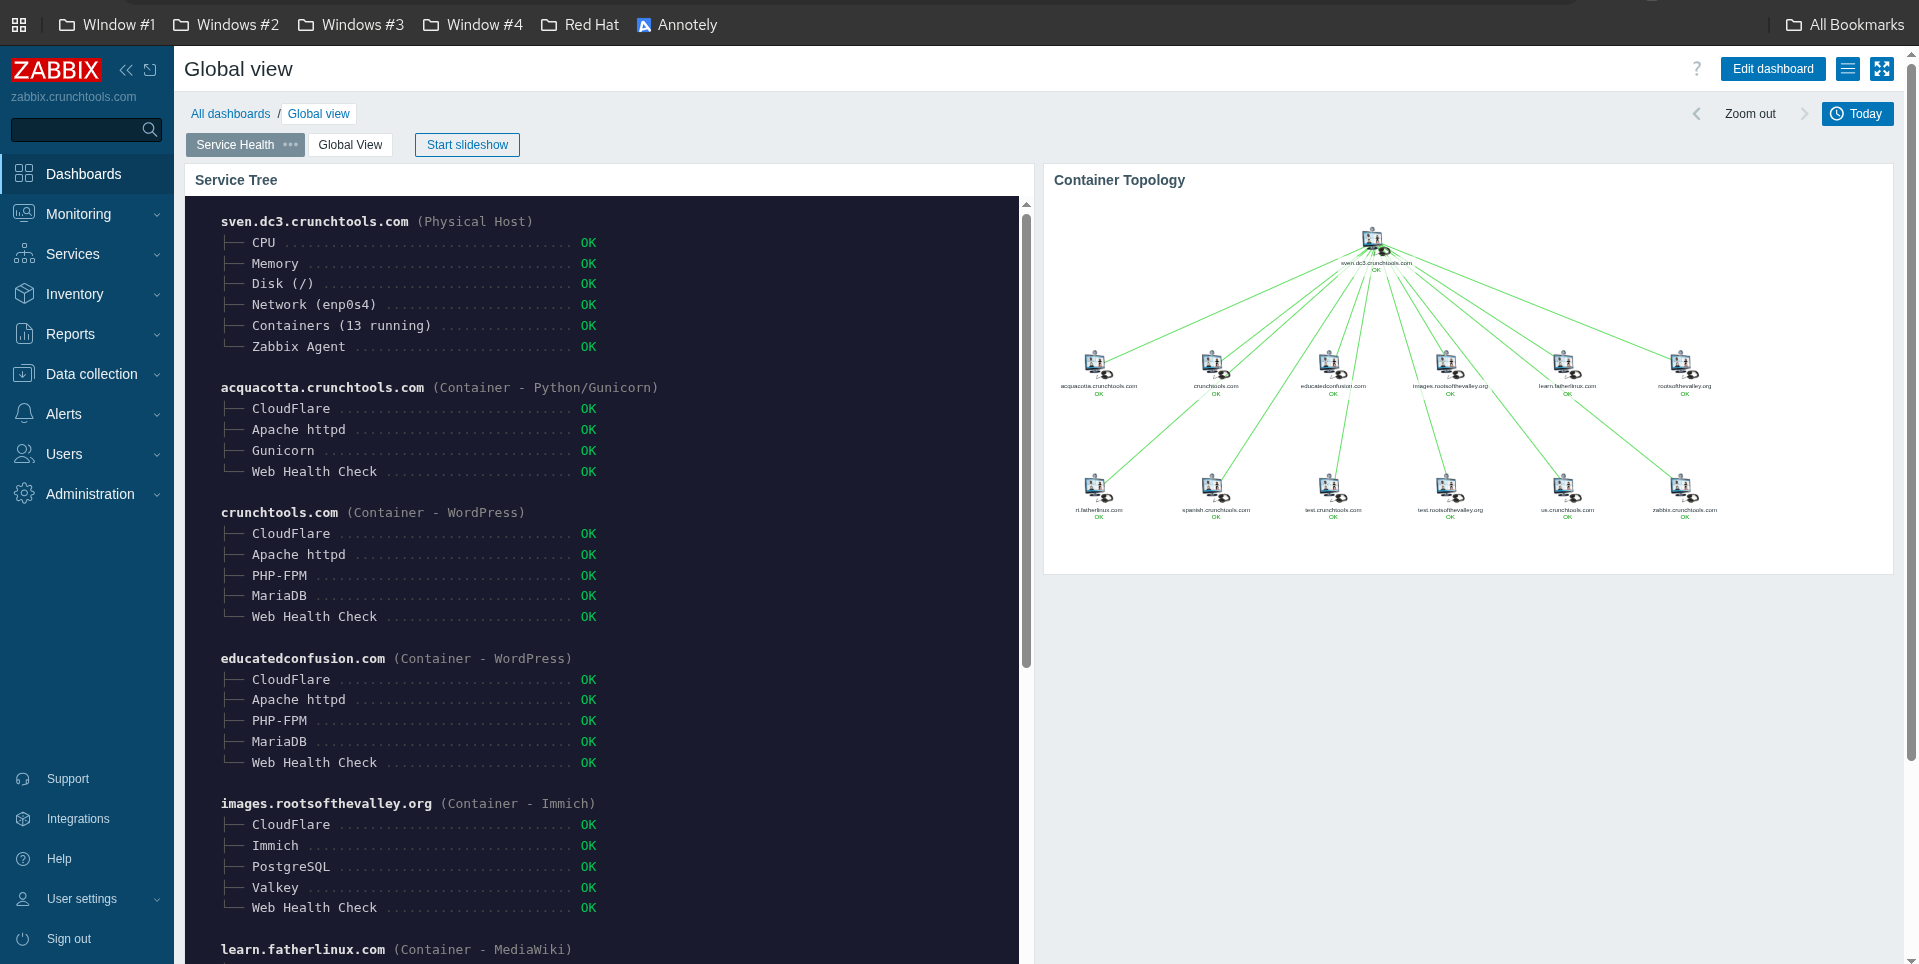The finished Zabbix dashboard — Service Tree (left) showing real-time host and service status, Container Topology (right) showing the IT Services dependency map
## The Payoff
The result is a monitoring stack that actually tells me what I need to know:
- **Service tree page**: Instant visual status of everything, authenticated with API tokens instead of passwords
- **IT Services hierarchy**: Parent/child dependencies with automatic status rollup
- **CloudFlare integration**: CDN health visible alongside application health
- **Automated access through MCP**: Claude Code can query Zabbix directly to more quickly troubleshoot issues
- **CI/CD with real testing**: Every push triggers a [GitHub Actions pipeline](https://github.com/crunchtools/zabbix/actions) that builds the image and runs two rounds of tests — static checks that verify every package, config file, and systemd unit is in place, then runtime tests that actually boot the container with systemd, wait for PostgreSQL to initialize, import the Zabbix schema, and confirm that the web UI and zabbix-server process come up healthy. Nothing gets pushed to the registry unless all of that passes.
- **Pre-built image**: The tested image is published to [`quay.io/crunchtools/zabbix:latest`](https://quay.io/repository/crunchtools/zabbix) and rebuilds weekly to pick up base image security updates. Production just pulls and restarts — no more building on the server.
- **One container**: Consistent with everything else, easy to maintain
All of this runs on a single Linode VPS hosting 13 containers. The monitoring infrastructure is the same pattern as the things it monitors — which is exactly how it should be.
If you’re building something similar on UBI or RHEL, the Containerfile and CI pipeline are at [github.com/crunchtools/zabbix](https://github.com/crunchtools/zabbix), and the pre-built image is at [quay.io/crunchtools/zabbix](https://quay.io/repository/crunchtools/zabbix). And remember: check your `libcurl`. The minimal package will save you a few megabytes and cost you hours of debugging when Zabbix Script items silently fail on HTTPS calls.
---
## Categories
- Articles
---
## Navigation
- [Home](https://crunchtools.com/)
- [Articles](https://crunchtools.com/category/articles/)
- [Events](https://crunchtools.com/category/events/)
- [News](https://crunchtools.com/category/news/)
- [Presentations](https://crunchtools.com/category/presentations/)
- [Software](https://crunchtools.com/software/)
- [Beaver Backup](https://crunchtools.com/software/beaver-backup/)
- [Check BGP Neighbors](https://crunchtools.com/software/check-bgp-neighbors-nagios/)
- [Chev](https://crunchtools.com/software/chev-check-vulnerabilities-script/)
- [Graph BGP Neighbors](https://crunchtools.com/software/grpah-bgp-neighbors/)
- [Graph MySQL Stats](https://crunchtools.com/software/graph-mysql-stats/)
- [Graph Sockets Pipes Files](https://crunchtools.com/software/graph-sockets-pipes-files/)
- [MCP Servers](https://crunchtools.com/software/mcp-servers/)
- [Petit](https://crunchtools.com/software/petit/)
- [Racecar](https://crunchtools.com/software/racecar/)
- [Shiva](https://crunchtools.com/software/shiva/)
- [About](https://crunchtools.com/about/)
- [Home](https://crunchtools.com)