Background
Since everything in Linux/Unix is a file, Linux has some interesting ways to monitor for problems. Often systems administrators monitor CPU, Ram, Disk Space, and Network Usage. These are all valid data points and are especially useful for capacity planning. For real time detection of problems, especially with web/application/databases, these are not always the best indicators. In my experience, checking and trending the number of open sockets, pipes, files, tcp/udp sockets, and unix sockets has been the single best indicator of a problem. These have been much better than CPU, Load, or I/O Wait. In fact, under optimal usage of server hardware, one would expect spikes in CPU, RAM, and I/O.
Download
Cacti Wiki
Cacti Forums
Versioned Code
Architecture
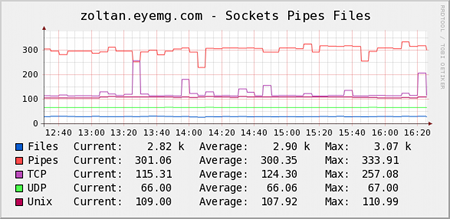
This graph is an overlay of five important indicators, they are described below. Notice that the number of files is devided by 100 for purpose of graphing. This done in the graph template and can be tuned for different applications. This is just what worked well for us.
- Files: Number of open files per /proc
- Pipes: Number of open pipes per lsof
- TCP: Number of open TCP sockets per netstat
- UDP: Number of open UDP sockets per netstat
- Unix: Number of open Unix sockets per netstat
This graph requires several files to work correctly. They are described below
- sockets_pipes_files_poller.sh – This is collector script used on the cacti server
- sockets_pipes_files_client.sh – This script is used to send information back to cacti, it is also used by a sister Nagios check
- sockets_pipes_files_template.xml – Templates file which is imported in Cacti in web interface
Installation
There is both a server component and a node component
Cacti Server
Import XML template on the cacti server
spf_cacti.xml
Copy the poller script out to the cacti server (could be different on your server)
/var/www/html/cacti/scripts/spf_poller.sh
Remote Node
Install perl/net-snmpd components
yum install -y net-snmp-perl
Copy the client script to the client
/etc/snmp/spf.pl
Configure snmp on the client and restart. Generally, this is in /etc/snmp/snmpd.conf
perl do '/etc/snmp/spf.pl';

service snmpd restart
In Cacti, add the graph template
Cacti Web Interface -> devices -> server.example.com -> Associated Graph Templates -> Sockets Pipes Files -> AddCacti Web Interface -> Create Graphs for this Host -> Create: Sockets Pipes Files -> Check -> Create
