---
# Centralized Logging System, Analysis, and Troubleshooting
**URL:** https://crunchtools.com/centralizing-log-files/
Date: 2010-06-22
Author: fatherlinux
Post Type: post
Summary: Background Building a feature complete centralized logging system that provided the ability to trouble shoot problems and pro-actively find new issues before they became service outages was a top priority when I first started at (www.eyemg.com). I call it feature complete because it has successfully done both for us without spending too much time ofContinue Reading "Centralized Logging System, Analysis, and Troubleshooting" →
Categories: Articles
Tags: Logging, Systems Administration
---
[toc]
# Background
Building a *feature complete* centralized **logging system** that provided the ability to trouble shoot problems and pro-actively find new issues before they became service outages was a top priority when I first started at ([www.eyemg.com](http://www.eyemg.com)). I call it feature complete because it has successfully done both for us without spending too much time of false positives.
In this post I will review the design decisions that went into creating our, more or less, feature complete centralized logging system. Generally, the words "log analysis" and "logging system" are thrown around as buzz words in an attempt to sell a product, but this post is a genuine attempt to identify best practices that any systems administrator should be aware of. Another goal here, is to identify systems and feature other administrators have in place to achieve a feature complete logging system, so comments are welcomed and encouraged.
## Goals & Workflows
For us, feature complete meant that we could could leverage our centralized logging system to assist in the completion of two main workflows.
- **Daily & Monthly Log Analysis**: Provides proactive searching for issues which might not be identified by our service monitoring system (Nagios)
- **Point Problem Research**: Used when a service outage or issue has already been identified through another mechanism, usually Nagios or a human being that noticed the problem.
## Assumptions & Philosophy
The creation of this system was based on some critical conclusions about entropy, reality, and the universe in general.
- **Approximately Right**: Is better than absolutely wrong. No analysis is perfect, by it's very nature it is qualitative and imperfect, but none the less, genuine value can be gained from it
- **The 80/20 Rule**: Log analysis has the classic economic problem of unlimited want and limited resource. We must find a level of investment which we are comfortable with. In general, %80 or of our goals can be achieved with %20 of the work, so don't invest too much
- **Approximation of an Approximation of Reality**: Logs by their very nature are an approximation of what the programmer thinks is happening in his program. It is important to remember this because some of the log analysis techniques used here will give an approximation of what is happening in the logs
## Policy
Policy will have a profound effect on what must be implemented in a feature complete logging system. The following is a non-exhaustive list of laws and industry standards that might affect your retention policy. One of the goals of this article is to fill in some best practices even when the following do not apply. This guide is meant to give common sense best practices.
- [Sarbanes–Oxley Act](http://en.wikipedia.org/wiki/Sarbanes%E2%80%93Oxley_Act)
- [PCI](http://en.wikipedia.org/wiki/PCI_DSS)
For more information on how to create a log review policy, especially in a PCI environment, Anton Chuvakin has excellent documentation including books, blog entries and a website.
- [Anton A. Chuvakin](http://www.chuvakin.org/)
## Technology
This is just a quick overview of the different pieces of software we use in an all Red Hat Linux environment. This could also be used for Windows systems if their event logs are shipped to syslog, which can be done.
- [syslog-ng](http://www.balabit.com/network-security/syslog-ng/opensource-logging-system): Used on central receiving server
- [syslog](http://linux.die.net/man/8/syslogd): Default install on all Redhat Linux systems
- [petit](http://crunchtools.com/petit): log analysis tool used to create reports and do spot analysis
- [Log Formats](http://chuvakin.blogspot.com/search/label/standards): apache access, apache error, linux syslog, secure logs
# Infrastructure
[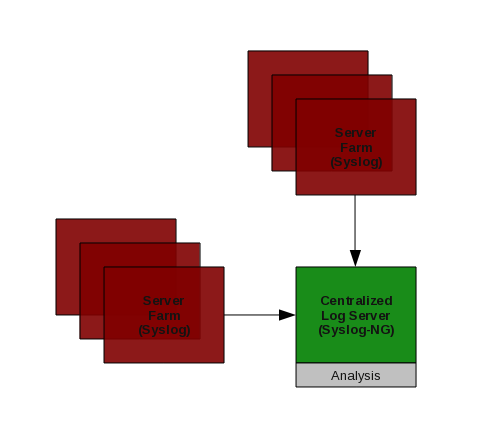](http://crunchtools.com/wp-content/uploads/2010/06/CentralizedLogAnalysis1.png)
## Syslog-NG
On our syslog collector we installed syslog-ng, this fits the qualitative to quantitative work flow because it is not necessary to install it on every machine, only the centralized collector.
First download it
wget http://www.balabit.com/downloads/files/syslog-ng/sources/stable/src/eventlog-0.2.5.tar.gz
wget http://www.balabit.com/downloads/files/syslog-ng/sources/stable/src/syslog-ng-2.0.8.tar.gz
### Compile & Install
Eventlog is a requirement for syslog-ng. Installed in /usr/local/eventlog
cp /srv/operations/server/software /root/software/
tar xvfz eventlog-0.2.7.tar.gz
cd eventlog-0.2.7
./configure --prefix=/usr/local/eventlog
make
make install
Syslog-ng
cp /srv/operations/server/software/misc/syslog-ng-2.0.8.tar.gz /root/software/
tar xvfz /root/software/syslog-ng-2.0.8.tar.gz
cd /root/software/syslog-ng-2.0.8
export PKG_CONFIG_PATH=/usr/local/eventlog/lib/pkgconfig
./configure --prefix=/usr/local/syslog-ng
make
make install
### Init Scripts
Modify redhat's basic syslog script and save it
cp /etc/init.d/syslog /etc/init.d/syslog-ng
vi /etc/init.d/syslog-ng
Then find/replace all instances of syslog with syslog-ng, this should get you close to having an init script that works
`:%s/syslog/syslog-ng/g`
### Log Rotation
Remember to modify log rotate to include new logs added and also to restart syslog-ng instead of syslogd
`/etc/logrotate.d/syslog`
### Clean Up & Clarification
Make sure people are not starting or trying to modify syslogd
rm /etc/syslog.conf
echo "#################################################################" >> /etc/syslog.conf.replaced
echo "#" >> /etc/syslog.conf.replaced
echo "# This server is running syslog-ng" >> /etc/syslog.conf.replaced
echo "#" >> /etc/syslog.conf.replaced
echo "# See /usr/local/syslog-ng/etc/syslog-ng.conf" >> /etc/syslog.conf.replaced
echo "#" >> /etc/syslog.conf.replaced
echo "#################################################################" >> /etc/syslog.conf.replaced
mv /etc/init.d/syslogd /etc/init.d/syslogd.disabled
ln -s syslog-ng /etc/init.d/syslogd
### Configuration
Since our Syslog-NG daemon captures all of our servers, routers, switches, and firewalls logs, the configuration file is somewhat long & verbose. There are four main types of entries understand. Sources, Destinations, Filters and Logs must be specified to have a working Syslog-NG daemon.
Sources allow syslog-ng to receive entries from the local log file and the network. Destination entries connect a label to a physical file, while filters connect a matching pattern (regex) to a label. The Log entries connect it all together. It is a little confusing at first, but allows for a lot of flexibility. Use the example configuration file as a guideline.
Notice that the "filter default" section has many entries that look similar to the following. These are logically equivalent to "grep -v", they remove the pattern that is matched. If you don't want to duplicate data, it is necessary to do this for entries which are split off into separate files.
`and not match("postfix\/")`
For example, if you want postfix entries to go to /var/log/maillog and you don't want them to be duplicated in /var/log/messages, you need to apply a filter similar to the one above. I won't dig into the details of each entry in our configuration file, but complex rule sets can be constructed for your needs. Separating logs by type is critical for more advanced log analysis, it could be done later with grep, but it is convenient to have the work done for you with syslog-ng. Again, since it is central, it is a finite amount of work to setup and does not require linear scaling, e.g. installed on every server of every kind of operating system.
#### Example Configuration File
`vim /usr/local/syslog-ng/etc/syslog-ng.conf`
# Options
options {
chain_hostnames(off);
use_fqdn(yes);
sync(0);
stats(43200);
perm(0644);
};
# Sources
source src1 {
unix-stream("/dev/log" max-connections(256));
internal();
file("/proc/kmsg");
};
source src2 { udp(); };
# Destinations
destination messages { file("/var/log/messages"); };
destination console_all { file("/dev/tty12"); };
destination firewall { file("/var/log/firewall"); };
destination firewall_db { file("/var/log/firewall_db"); };
destination router { file("/var/log/router"); };
destination snmpd { file("/var/log/snmpd.log"); };
destination named { file("/var/log/named.log"); };
destination cron { file("/var/log/cron"); };
destination traceroute { file("/var/log/traceroute"); };
destination nagios { file("/var/log/nagios"); };
destination maillog { file("/var/log/maillog"); };
destination secure { file("/var/log/secure"); };
destination ntpd { file("/var/log/ntpd.log"); };
destination cacti { file("/var/log/cacti.log"); };
destination dhcpd { file("/var/log/dhcpd.log"); };
destination samba { file("/var/log/samba.log"); };
destination backup { file("/var/log/backup.log"); };
destination script { file("/var/log/script.log"); };
destination drbd { file("/var/log/drbd.log"); };
destination chev { file("/var/log/chev.log"); };
# Filters
filter default { not facility(mail) and not match("postfix\/") and not facility(cron) and not match("PIX") and not host("ro-ak-c1") and not host("ro-ak-c2") and not host("ro-fp-c1") and not match("snmpd") and not match("named") and not match("traceroute") and not match("nagios") and not match("ntpd") and not match("Cacti") and not match("Cacti") and not match("dhcpd") and not match("smbd") and not match("nmbd") and not match("_backup") and not match("EYEMG_SCRIPT") and not match("drbd") and not match("__CkV__"); };
filter maillog { facility(mail) or match("postfix\/"); };
filter authpriv { facility(authpriv); };
filter cron { facility(cron); };
filter firewall { match("PIX"); };
filter emerg_notice { level(emerg..notice); };
filter emerg_debug { level(emerg..debug); };
filter firewall { match("PIX"); };
filter info { level(info); };
filter router { host("ro-ak-c1") or host("ro-ak-c2") or host("ro-fp-c1"); };
filter snmpd { match("snmpd"); };
filter named { match("named"); };
filter traceroute { match("traceroute"); };
filter nagios { match("nagios:"); };
filter ntpd { match(ntpd); };
filter cacti { match("Cacti"); };
filter dhcpd { match("dhcpd"); };
filter samba { match("smbd") or match("nmbd"); };
filter backup { match("_backup"); };
filter script { match("EYEMG_SCRIPT") and not match("nagios"); };
filter drbd { match("drbd"); };
filter chev { match("__CkV__"); };
# Logs
log { source(src1); source(src2); filter(default); destination(messages); };
log { source(src1); source(src2); destination(console_all); };
log { source(src1); source(src2); filter(firewall); filter(emerg_notice); destination(firewall); };
log { source(src1); source(src2); filter(firewall); filter(info); destination(firewall_db); };
log { source(src1); source(src2); filter(router); destination(router); };
log { source(src1); source(src2); filter(snmpd); destination(snmpd); };
log { source(src1); source(src2); filter(maillog); destination(maillog); };
log { source(src1); source(src2); filter(named); destination(named); };
log { source(src1); source(src2); filter(cron); destination(cron); };
log { source(src1); source(src2); filter(traceroute); destination(traceroute); };
log { source(src1); source(src2); filter(nagios); destination(nagios); };
log { source(src1); source(src2); filter(authpriv); destination(secure); };
log { source(src1); source(src2); filter(ntpd); destination(ntpd); };
log { source(src1); source(src2); filter(cacti); destination(cacti); };
log { source(src1); source(src2); filter(dhcpd); destination(dhcpd); };
log { source(src1); source(src2); filter(samba); destination(samba); };
log { source(src1); source(src2); filter(backup); destination(backup); };
log { source(src1); source(src2); filter(script); destination(script); };
log { source(src1); source(src2); filter(drbd); destination(drbd); };
log { source(src1); source(src2); filter(chev); destination(chev); };
# Analysis
## Daily Log Analysis
This is an example of how we do our daily log analysis. This report is received in an email and takes 3-5 minutes to read every morning. Clearly, the goal is not perfection, but to catch gross anomalies in the system before they cause major problems. In other systems, this system has scaled to 1500 Linux server with similar success. The number of unique entries does not grow linearly with the number of servers so it is a useful tool even if you have thousands of servers. Monthly log analysis has similar scaling properties.
### Code
#!/bin/bash
#
# Written By: Scott McCarty
# Date: 6/2010
# Version: .5
# Description: Daily log report to help get a wrangle on what is happening
init() {
# Commands
cat=`which cat`
zcat=`which zcat`
head=`which head`
tail=`which tail`
grep=`which grep`
egrep=`which egrep`
awk=`which awk`
basename=`which basename`
# Yesterdays date formatted for syslog
yesterday=`/bin/date -d 'yesterday' +"%b %e"`
# Variables
petit1="/usr/bin/petit --hgraph --wide"
petit2="/usr/bin/petit --hash --fingerprint"
petit3="/usr/bin/petit --daemon"
petit4="/usr/bin/petit --host"
echo "$catmessages"
}
get_messages() {
($zcat /var/log/messages.1.gz;$cat /var/log/messages) | grep "$yesterday"
}
get_secure() {
($zcat /var/log/secure.1.gz;$cat /var/log/secure) | grep "$yesterday"
}
login_report() {
# REPORT 1: Login Information
echo ""; echo "Login Report"
get_secure | $egrep "(Accepted|Failed)" | $petit1
echo ""; echo "Failed Logins:"
get_secure | $grep "Failed " | $awk '{$11="";print $0}'
echo ""; echo "Successful Logins:"
get_secure | $grep "Accepted " | $petit2 --allsample
echo ""; echo "Daemons:"
get_secure | $petit3
echo ""; echo "Hosts:"
get_secure | $petit4 | $head -n 10
}
problems_report() {
# Variables
report_file="/tmp/`$basename $0`.problems_report"
echo ""; echo "Problems Report"
get_messages | $grep -v Tapes | $grep -v "Failed password" | $grep -v sshd | $grep -v _backup | $grep -v 'snort' | grep -v "last message repeated" | $petit1
get_messages | $grep -v Tapes | $grep -v "Failed password" | $grep -v sshd | $grep -v _backup | $grep -v 'snort' | grep -v "last message repeated" | $petit2 > $report_file
echo ""; echo "Errors, Problems & Warnings"
cat $report_file | $egrep -i "(err|fail|warn|abnormal|fatal|can't)"
echo ""; echo "Kernel Entries"
cat $report_file | $egrep -i "(kernel)"
echo ""; echo "Cluster Entries"
cat $report_file | $egrep -i "(clurgmgrd|openais)"
echo ""; echo "Everything Else"
cat $report_file | $egrep -iv "(err|fail|warn|abnormal|fatal|can't|kernel|clurgmgrd|openais)"
echo ""; echo "Daemons:"
get_messages | $petit3
echo ""; echo "Hosts:"
get_messages | $petit4 | $head -n 10
}
init $*
login_report
problems_report
### Output
`Login Report`
#
# # #
# # #
# # # # # #
# # # # # # # # # # # # # # # # # # # # # # #
# # # # # # # # # # # # # # # # # # # # # # # #
00 12 23
Start Time: 2010-06-21 00:00:00 Minimum Value: 490
End Time: 2010-06-21 23:00:00 Maximum Value: 1110
Duration: 24 hours Scale: 103.333333333
Failed Logins:
Successful Logins:
14145: Accepted publickey for #
23: Accepted password for #
Daemons:
38834: sshd[#]:
Hosts:
11795: maddock.eyemg.com
5831: tavis.eyemg.com
4856: mobius.eyemg.com
3155: sable.eyemg.com
2968: gannon.eyemg.com
2745: tony.eyemg.com
2484: dino.eyemg.com
1377: fumiko.eyemg.com
833: fumo.eyemg.com
760: tpm-secure.eyemg.com
Problems Report
# # # # # # #
# # # # # # # #
# # # # # # # # #
# # # # # # # # # # # # #
# # # # # # # # # # # # # # # # # # # # # # #
# # # # # # # # # # # # # # # # # # # # # # # #
00 12 23
Start Time: 2010-06-21 00:00:00 Minimum Value: 1207
End Time: 2010-06-21 23:00:00 Maximum Value: 1375
Duration: 24 hours Scale: 28.0
Errors, Problems & Warnings
28: kernel: set_rtc_mmss: can't update from # to #
3: authentication failure; logname= uid=0 euid=0 tty= ruser= rhost=204.9.85.210 user=rwcomms
1: Failed to detect rack, cpqriisd exiting....
1: [error] [client 194.72.238.62] Invalid method in request \\x16\\x03\\x01
1: ACPI: PCI Interrupt 0000:01:04.6[A] -> GSI 21 (level, low) -> IRQ 209
1: ACPI: PCI Interrupt 0000:01:04.2[B] -> GSI 22 (level, low) -> IRQ 217
1: ipmi_si: Using PCI Plug and Play interrupt 209
Kernel Entries
28: kernel: set_rtc_mmss: can't update from # to #
Cluster Entries
5749: clurgmgrd: [#]: Executing /etc/init.d/mysqld status
5739: clurgmgrd: [#]: Executing /etc/init.d/httpd status
2855: clurgmgrd: [#]: Executing /etc/init.d/nfs status
Everything Else
6115: crond(pam_unix)[#]: session opened for user root by (uid=#)
6113: crond(pam_unix)[#]: session closed for user root
936: flow-capture[#]: remove/#/#-#/#-#-#/ft-v#.#-#-#.#-#
936: flow-capture[#]: unlink(#/#-#/#-#-#/ft-v#.#-#-#.#-#): No such file or directory
864: flow-capture[#]: STAT: now=# startup=# src_ip=#.#.#.# dst_ip=#.#.#.# d_ver=# pkts=# flows=# lost=# reset=# filter_drops=#
329: ucd-snmp[#]: Connection from #.#.#.#
25: flow-capture[#]: ftpdu_seq_check(): src_ip=#.#.#.# dst_ip=#.#.#.# d_version=# expecting=# received=# lost=#
6: auditd[#]: Audit daemon rotating log files
2: eth1 entered promiscuous mode
2: eth1 left promiscuous mode
1: Inconsistent stripe, LDrv=0 LBA=0x002DB4800-0x002DB48FF
1: cmanicd shutdown succeeded
1: Process has been instructed to stop from the user interface. Starting Shutdown process. . .
1: cpqci shutdown succeeded
1: cpqci startup succeeded
1: cpqriisd startup succeeded
1: httpd shutdown succeeded
1: httpd startup succeeded
1: IPMI System Interface driver version v33, KCS version v33, SMIC version v33, BT version v33
1: IPMI kcs interface [0] initialized
1: ipmi device interface version v33
1: ipmi message handler version v33
1: ipmi_si: Found PCI BMC at BAR address 0xf7ef0000
1: ipmi_si: Searching for PCI Vendor 0x103c, Device 0x3302
1: ipmi_si: Trying "kcs" at memory address 0xf7ef0000
Daemons:
38834: sshd[#]:
14343: clurgmgrd:
12888: sshd(pam_unix)[#]:
12228: crond(pam_unix)[#]:
2761: flow-capture[#]:
523: snort[#]:
329: ucd-snmp[#]:
38: kernel:
6: auditd[#]:
4: device
3: hprsm:
3: vsftpd(pam_unix)[#]:
2: httpd:
1: cmaeventd[#]:
1: cmanicd:
1: cpqriisd:
1: hpasmxld[#]:
1: httpd[#]:
Hosts:
17444: tavis.eyemg.com
15020: sable.eyemg.com
11796: maddock.eyemg.com
7733: tpm-secure.eyemg.com
5867: tpm-dev.eyemg.com
5760: mathus.eyemg.com
4858: mobius.eyemg.com
4844: tony.eyemg.com
4436: gannon.eyemg.com
2484: dino.eyemg.com
### Analysis
Individual entries which are found to be interesting can be inspected like this:
(zcat /var/log/messages.*.gz;cat /var/log/messages) | grep "`/bin/date -d 'yesterday' +"%b %d"`" | grep "I/O error occurred while writing"
## Monthly Log Analysis
While this code is not as elegant as I would like, I thought it was important to show a work in progress. This code gets the major pieces done, but it could be written in a way that made it easier to expand/add new log files. On the flip side, this script has been used for over a year in production and only required very minimal changes. It is a testament to the fact that infrastructure does not change quite as often as one might think.
Some things to note; First, there is a check at the beginning of this script to ensure that it is running on our man analysis box. This prevents it from running on the wrong machine. Second, there are notes to the analyst about each log file, which is output to the screen during run time. This gives the analyst notes on how much time to spend on analyzing each log file. It also gives the analyst notes on important aspects of the analysis. It is a simple solution, but quite elegant.
Finally, when an interesting line is found, it can be analyzed with the script it's self by passing a match string and a log file to analyze. The script is smart enough to get historic data and grep through everything. SEE "Example Analysis" below:
### Code
#!/bin/bash
#
# Written By: Scott McCarty
# Email: [email protected]
# Date: 2/2009
# Description: Simple little batch file to keep track of monthly log analysis.
# Even logs that are not analyzed are kept track of in here just in case new
# ones are added.
# Safety check
if [ $HOSTNAME != "zoltan.eyemg.com" ]
then
echo "Bad: cannot run this script on $HOSTNAME"
exit
else
echo "Good: running on $HOSTNAME"
fi
# Global Variables
cat="/bin/cat"
zcat="/bin/zcat"
grep="/bin/grep"
egrep="/bin/egrep"
petit=`which petit`
log_directory="/var/log"
this_month=`date -d 'now' | awk '{print $2}'`
last_month=`date -d 'last month' | awk '{print $2}'`
month_string="$last_month [0-9][0-9]|$last_month [0-9]"
report () {
# Initial Cleanup
rm -f /tmp/analyze_logs.*
# Fist check to see which logs are being parsed and which ones are not
for log in `ls /var/log | grep -v "\.gz"`
do
#######################################################################
# Analysis
#######################################################################
# Skip these logs
if [ "$log" == "acpid" ] ||
[ "$log" == "anaconda.log" ] ||
[ "$log" == "anaconda.syslog" ] ||
[ "$log" == "audit" ] ||
[ "$log" == "backup.log" ] ||
[ "$log" == "bind" ] ||
[ "$log" == "boot.log" ] ||
[ "$log" == "boxstatus.txt" ] ||
[ "$log" == "btmp" ] ||
[ "$log" == "conman" ] ||
[ "$log" == "conman.old" ] ||
[ "$log" == "cups" ] ||
[ "$log" == "dmesg" ] ||
[ "$log" == "faillog" ] ||
[ "$log" == "firewall" ] ||
[ "$log" == "firewall_db" ] ||
[ "$log" == "gdm" ] ||
[ "$log" == "hppldu.log" ] ||
[ "$log" == "httpd" ] ||
[ "$log" == "lastlog" ] ||
[ "$log" == "mail" ] ||
[ "$log" == "maillog" ] ||
[ "$log" == "messages" ] ||
[ "$log" == "mysqld.log" ] ||
[ "$log" == "ppp" ] ||
[ "$log" == "prelink" ] ||
[ "$log" == "README" ] ||
[ "$log" == "rpmpkgs" ] ||
[ "$log" == "sa" ] ||
[ "$log" == "samba" ] ||
[ "$log" == "scrollkeeper.log" ] ||
[ "$log" == "setroubleshoot" ] ||
[ "$log" == "traceroute" ] ||
[ "$log" == "spooler" ] ||
[ "$log" == "vmware" ] ||
[ "$log" == "vmware-mui" ] ||
[ "$log" == "wtmp" ] ||
[ "$log" == "vbox" ] ||
[ "$log" == "Xorg.0.log" ] ||
[ "$log" == "Xorg.0.log.old" ] ||
[ "$log" == "yum.log" ]
then
continue
elif [ "$log" == "cacti.log" ]
then
# Process cacti logs
echo "Processing Log: $log"
echo "#######################################################################" >> /tmp/analyze_logs.cacti
echo "# Log: Cacti" >> /tmp/analyze_logs.cacti
echo "# File Set: $log_directory/$log" >> /tmp/analyze_logs.cacti
echo "# Priority: Low" >> /tmp/analyze_logs.cacti
echo "# Descripition: Most errors are caught by using the interface report" >> /tmp/analyze_logs.cacti
echo "# Just give this log a quick look" >> /tmp/analyze_logs.cacti
echo "#######################################################################" >> /tmp/analyze_logs.cacti
($zcat $log_directory/cacti.log.[1-9].gz; $cat $log_directory/cacti.log) |
$egrep "$month_string" |
$grep -v EYEMG_SCRIPT |
$petit --hash >> /tmp/analyze_logs.cacti
elif [ "$log" == "cron" ]
then
echo "Processing Log: $log"
echo "#######################################################################" >> /tmp/analyze_logs.cron
echo "# Log: Cron" >> /tmp/analyze_logs.cron
echo "# File Set: $log_directory/$log" >> /tmp/analyze_logs.cron
echo "# Priority: Low" >> /tmp/analyze_logs.cron
echo "# Descripition: There is not normally much in this log except file" >> /tmp/analyze_logs.cron
echo "# permission issues and small errors. Most are caught by scriptlog" >> /tmp/analyze_logs.cron
echo "#######################################################################" >> /tmp/analyze_logs.cron
(zcat $log_directory/cron.[1-9].gz; cat $log_directory/cron) |
egrep "$month_string" |
$petit --hash |
egrep "(BAD|ERROR|FAILED)" >> /tmp/analyze_logs.cron
elif [ "$log" == "dhcpd.log" ]
then
echo "Processing Log: $log"
echo "#######################################################################" >> /tmp/analyze_logs.dhcpd
echo "# Log: dhcpd.log" >> /tmp/analyze_logs.dhcpd
echo "# File Set: $log_directory/$log" >> /tmp/analyze_logs.dhcpd
echo "# Priority: Low" >> /tmp/analyze_logs.dhcpd
echo "# Descripition: This is a fairly un-interesting log, but it is useful" >> /tmp/analyze_logs.dhcpd
echo "# when somebody can't get an IP address. Just look for majore problems." >> /tmp/analyze_logs.dhcpd
echo "#######################################################################" >> /tmp/analyze_logs.dhcpd
(zcat $log_directory/dhcpd.log.[1-5].gz; cat $log_directory/dhcpd.log) |
egrep "$month_string" |
$petit --hash >> /tmp/analyze_logs.dhcpd
elif [ "$log" == "nagios" ]
then
echo "Processing Log: $log"
echo "#######################################################################" >> /tmp/analyze_logs.nagios
echo "# Log: Nagios" >> /tmp/analyze_logs.nagios
echo "# File Set: $log_directory/$log" >> /tmp/analyze_logs.nagios
echo "# Priority: Low" >> /tmp/analyze_logs.nagios
echo "# Descripition: Look through this log to get a clue of what might be " >> /tmp/analyze_logs.nagios
echo "# happening." >> /tmp/analyze_logs.nagios
echo "#######################################################################" >> /tmp/analyze_logs.nagios
(zcat $log_directory/nagios.[1-5].gz; cat $log_directory/nagios) |
egrep "$month_string" |
grep -v CRITICAL | grep -v OK |
grep -v ALERT | grep -v UNREACHABLE |
grep -v UNKNOWN | grep -v SOFT |
grep -v FLAPPING | grep -v NOTIFICATION |
grep -v ACKNOWLEDGE | grep -v WARNING |
grep -v "CURRRENT SERVICE STATE" |
$petit --hash >> /tmp/analyze_logs.nagios
elif [ "$log" == "named.log" ]
then
echo "Processing Log: $log"
echo "#######################################################################" >> /tmp/analyze_logs.named
echo "# Log: Bind" >> /tmp/analyze_logs.named
echo "# File Set: $log_directory/$log" >> /tmp/analyze_logs.named
echo "# Priority: Moderate" >> /tmp/analyze_logs.named
echo "# Descripition: Look for interesting errors here because DNS does not" >> /tmp/analyze_logs.named
echo "# get much attention when it is working" >> /tmp/analyze_logs.named
echo "#######################################################################" >> /tmp/analyze_logs.named
(zcat $log_directory/named.log.[1-5].gz; cat $log_directory/named.log) |
$egrep "$month_string" |
grep "named\[" |
grep -v ': unexpected RCODE ' |
grep -v ': FORMERR resolving ' |
grep -v ': lame server resolving ' |
grep -v ': loaded serial ' |
grep -v "postfix\/" | $petit --hash >> /tmp/analyze_logs.named
elif [ "$log" == "ntpd.log" ]
then
echo "Processing Log: $log"
echo "#######################################################################" >> /tmp/analyze_logs.ntpd
echo "# Log: NTPD" >> /tmp/analyze_logs.ntpd
echo "# File Set: $log_directory/$log" >> /tmp/analyze_logs.ntpd
echo "# Priority: Moderate" >> /tmp/analyze_logs.ntpd
echo "# Descripition: Not being able to find the time server is the most" >> /tmp/analyze_logs.ntpd
echo "# common problem" >> /tmp/analyze_logs.ntpd
echo "#######################################################################" >> /tmp/analyze_logs.ntpd
(zcat $log_directory/ntpd.log.[1-5].gz; cat $log_directory/ntpd.log) |
$egrep "$month_string" |
grep "ntpd\[" |
grep -v 'Listening on interface' |
$petit --hash >> /tmp/analyze_logs.ntpd
(zcat $log_directory/ntpd.log.[1-5].gz; cat $log_directory/ntpd.log) |
grep "can't find host server" >> /tmp/analyze_logs.ntpd
elif [ "$log" == "router" ]
then
echo "Processing Log: $log"
echo "#######################################################################" >> /tmp/analyze_logs.router
echo "# Log: Router" >> /tmp/analyze_logs.router
echo "# File Set: $log_directory/$log" >> /tmp/analyze_logs.router
echo "# Priority: High" >> /tmp/analyze_logs.router
echo "# Descripition: It is critical to pay attention to this log because" >> /tmp/analyze_logs.router
echo "# there are a lot of unknowns and there are usually not very many" >> /tmp/analyze_logs.router
echo "# entries. We probably need to beef up our knowledge of this log file." >> /tmp/analyze_logs.router
echo "# It is good to look for interface/controller up/down events." >> /tmp/analyze_logs.router
echo "#######################################################################" >> /tmp/analyze_logs.router
(zcat $log_directory/router.[1-9].gz; cat $log_directory/router) |
$egrep "$month_string" |
$petit --hash >> /tmp/analyze_logs.router
(zcat $log_directory/router.[1-9].gz; cat $log_directory/router) |
$egrep "$month_string" |
grep UPDOWN >> /tmp/analyze_logs.router
elif [ "$log" == "samba.log" ]
then
echo "Processing Log: $log"
echo "#######################################################################" >> /tmp/analyze_logs.samba
echo "# Log: Samba" >> /tmp/analyze_logs.samba
echo "# File Set: $log_directory/$log" >> /tmp/analyze_logs.samba
echo "# Priority: Moderate" >> /tmp/analyze_logs.samba
echo "# Descripition: This usually has very little output. The key on the" >> /tmp/analyze_logs.samba
echo "# samba log is to look for anything that might seem strange, then">> /tmp/analyze_logs.samba
echo "# again, almost everything in the samaba log looks strange." >> /tmp/analyze_logs.samba
echo "# " >> /tmp/analyze_logs.samba
echo "#######################################################################" >> /tmp/analyze_logs.samba
(zcat $log_directory/samba.log.[1-9].gz; cat $log_directory/samba.log) |
$egrep "$month_string" |
$petit --hash >> /tmp/analyze_logs.samba
elif [ "$log" == "secure" ]
then
echo "Processing Log: $log"
echo "#######################################################################" >> /tmp/analyze_logs.ssh
echo "# Log: SSH" >> /tmp/analyze_logs.ssh
echo "# File Set: $log_directory/$log" >> /tmp/analyze_logs.ssh
echo "# Priority: High" >> /tmp/analyze_logs.ssh
echo "# Descripition: This log could be critical to catching serious problem" >> /tmp/analyze_logs.ssh
echo "# This log is actually a subset of the secure log" >> /tmp/analyze_logs.ssh
echo "# " >> /tmp/analyze_logs.ssh
echo "#######################################################################" >> /tmp/analyze_logs.ssh
(zcat $log_directory/secure.[1-9].gz; cat $log_directory/secure) |
$egrep "$month_string" |
grep "sshd\[" |
grep -v "Failed password for" |
grep -v "input_userauth_request: illegal" |
$petit --hash >> /tmp/analyze_logs.ssh
(echo -n "Failed Password Entries: ";zcat $log_directory/secure.[1-9].gz; cat $log_directory/secure) |
$egrep "$month_string" |
grep "Failed password for" |
wc -l >> /tmp/analyze_logs.ssh
elif [ "$log" == "snmpd.log" ]
then
echo "Processing Log: $log"
echo "#######################################################################" >> /tmp/analyze_logs.snmpd
echo "# Log: SNMPD" >> /tmp/analyze_logs.snmpd
echo "# File Set: $log_directory/$log" >> /tmp/analyze_logs.snmpd
echo "# Priority: Moderate" >> /tmp/analyze_logs.snmpd
echo "# Descripition: The output of this is fairly short, so give a good look" >> /tmp/analyze_logs.snmpd
echo "#######################################################################" >> /tmp/analyze_logs.snmpd
(zcat $log_directory/snmpd.log.[1-9].gz; cat $log_directory/snmpd.log) |
grep "snmpd\[" |
$egrep "$month_string" |
$petit --hash >> /tmp/analyze_logs >> /tmp/analyze_logs.snmpd
elif [ "$log" == "tapes.log" ]
then
echo "Processing Log: $log"
echo "#######################################################################" >> /tmp/analyze_logs.tapes
echo "# Log: Tapes" >> /tmp/analyze_logs.tapes
echo "# File Set: $log_directory/$log" >> /tmp/analyze_logs.tapes
echo "# Priority: Moderate" >> /tmp/analyze_logs.tapes
echo "# Descripition: This log is important from a backup perspective. The" >> /tmp/analyze_logs.tapes
echo "# Online Tape Media section should have a tape LastWritten" >> /tmp/analyze_logs.tapes
echo "# of the previous Thursday. This will determine if the log is working" >> /tmp/analyze_logs.tapes
echo "# correctly." >> /tmp/analyze_logs.tapes
echo "#######################################################################" >> /tmp/analyze_logs.tapes
tail -n48 $log_directory/tapes.log >> /tmp/analyze_logs.tapes
else
echo $log >> /tmp/analyze_logs.unprocessed
fi
done
#######################################################################
# Reporting
#######################################################################
less /tmp/analyze_logs.cacti
less /tmp/analyze_logs.cron
less /tmp/analyze_logs.dhcpd
less /tmp/analyze_logs.nagios
less /tmp/analyze_logs.named
less /tmp/analyze_logs.ntpd
less /tmp/analyze_logs.router
less /tmp/analyze_logs.samba
less /tmp/analyze_logs.ssh
less /tmp/analyze_logs.snmpd
less /tmp/analyze_logs.tapes
$cat /tmp/analyze_logs.unprocessed
echo "For more information or review see /tmp/analyze_logs.* files"
}
if [ "$1" == "report" ]
then
report
else
if [ -e "$1.1.gz" ]
then
(zcat $1.[1-9].gz; cat $1) |
$egrep "$month_string" |
$grep "$2"
else
(cat $1) |
$egrep "$month_string" |
$grep "$2"
fi
fi
### Output
The analysis script displays a report similar to the following output for each set of log files analyzed.
#######################################################################
# Log: Samba
# File Set: /var/log/samba.log
# Priority: Moderate
# Descripition: This usually has very little output. The key on the
# samba log is to look for anything that might seem strange, then
# again, almost everything in the samaba log looks strange.
#
#######################################################################
56: nmbd[#]: [#/#/#:#:#, #] nmbd/nmbd_workgroupdb.c:dump_workgroups(#)
56: nmbd[#]: dump workgroup on subnet #.#.#.#: netmask= #.#.#.#:
56: nmbd[#]: dump_workgroups()
45: nmbd[#]: MYGROUP(#) current master browser = UNKNOWN
35: nmbd[#]: MOBIUS # (Samba Server Version #.#.#-#.el#.#)
25: smbd[#]: [#/#/#:#:#, #] smbd/nttrans.c:call_nt_transact_ioctl(#)
25: smbd[#]: call_nt_transact_ioctl(#x#): Currently not implemented.
21: nmbd[#]: Got SIGHUP dumping debug info.
21: nmbd[#]: [#/#/#:#:#, #] nmbd/nmbd.c:process(#)
12: smbd[#]: Ignoring unknown parameter "quest ok"
12: smbd[#]: Unknown parameter encountered: "quest ok"
12: smbd[#]: [#/#/#:#:#, #] param/loadparm.c:lp_do_parameter(#)
12: smbd[#]: [#/#/#:#:#, #] param/loadparm.c:map_parameter(#)
11: nmbd[#]: ZOLTAN # (Samba Server)
10: nmbd[#]: ALFRED # (Samba Server)
10: smbd[#]: [#/#/#:#:#, #] lib/util_sock.c:read_data(#)
7: nmbd[#]: EYEMG(#) current master browser = UNKNOWN
7: smbd[#]: read_data: read failure for # bytes to client #.#.#.#. Error = No route to host
4: nmbd[#]: GIPPER # ()
4: nmbd[#]: LAMAR # ()
4: nmbd[#]: MICHAEL # (michael)
4: smbd[#]: [#/#/#:#:#, #] lib/util_sock.c:send_smb(#)
4: smbd[#]: [#/#/#:#:#, #] lib/util_sock.c:write_data(#)
2: EYEMG(1) current master browser = GIPPER
2: EYEMG(1) current master browser = MICHAEL
2: This response was from IP 10.0.8.80, reporting an IP address of 10.0.8.80.
2: [2010/05/06 11:02:26, 0] nmbd/nmbd_namequery.c:query_name_response(109)
2: query_name_response: Multiple (2) responses received for a query on subnet 10.0.8.52 for name EYEMG<1d>.
2: Error writing 16447 bytes to client. -1. (Broken pipe)
2: Error writing 4 bytes to client. -1. (Connection reset by peer)
2: [2010/05/17 09:48:49, 0] lib/util_sock.c:get_peer_addr(1232)
2: getpeername failed. Error was Transport endpoint is not connected
2: read_data: read failure for 948 bytes to client 10.0.4.208. Error = Connection reset by peer
2: write_data: write failure in writing to client 10.0.8.154. Error Broken pipe
2: write_data: write failure in writing to client 10.0.8.80. Error Connection reset by peer
1: read_data: read failure for 4 bytes to client 10.0.4.208. Error = Connection timed out
### Analysis
Indiividual entries can be inspected with the following command:
`/usr/local/eyemg/analyze_logs.sh /var/log/cron "STAT FAILED"`
---
## Categories
- Articles
---
## Navigation
- [Home](https://crunchtools.com/)
- [Articles](https://crunchtools.com/category/articles/)
- [Events](https://crunchtools.com/category/events/)
- [News](https://crunchtools.com/category/news/)
- [Presentations](https://crunchtools.com/category/presentations/)
- [Software](https://crunchtools.com/software/)
- [Beaver Backup](https://crunchtools.com/software/beaver-backup/)
- [Check BGP Neighbors](https://crunchtools.com/software/check-bgp-neighbors-nagios/)
- [Chev](https://crunchtools.com/software/chev-check-vulnerabilities-script/)
- [Graph BGP Neighbors](https://crunchtools.com/software/grpah-bgp-neighbors/)
- [Graph MySQL Stats](https://crunchtools.com/software/graph-mysql-stats/)
- [Graph Sockets Pipes Files](https://crunchtools.com/software/graph-sockets-pipes-files/)
- [MCP Servers](https://crunchtools.com/software/mcp-servers/)
- [Petit](https://crunchtools.com/software/petit/)
- [Racecar](https://crunchtools.com/software/racecar/)
- [Shiva](https://crunchtools.com/software/shiva/)
- [About](https://crunchtools.com/about/)
- [Home](https://crunchtools.com)
## Tags
- Logging
- Systems Administration